Hydronix Cement Savings Report
Company Name
Chillibyte
Contact Name
Dan Testing
Date
24 September, 2025
A link to this report was emailed to dan@chillibyte.co.uk
- Bookmark this link for future reference.
- Share via email
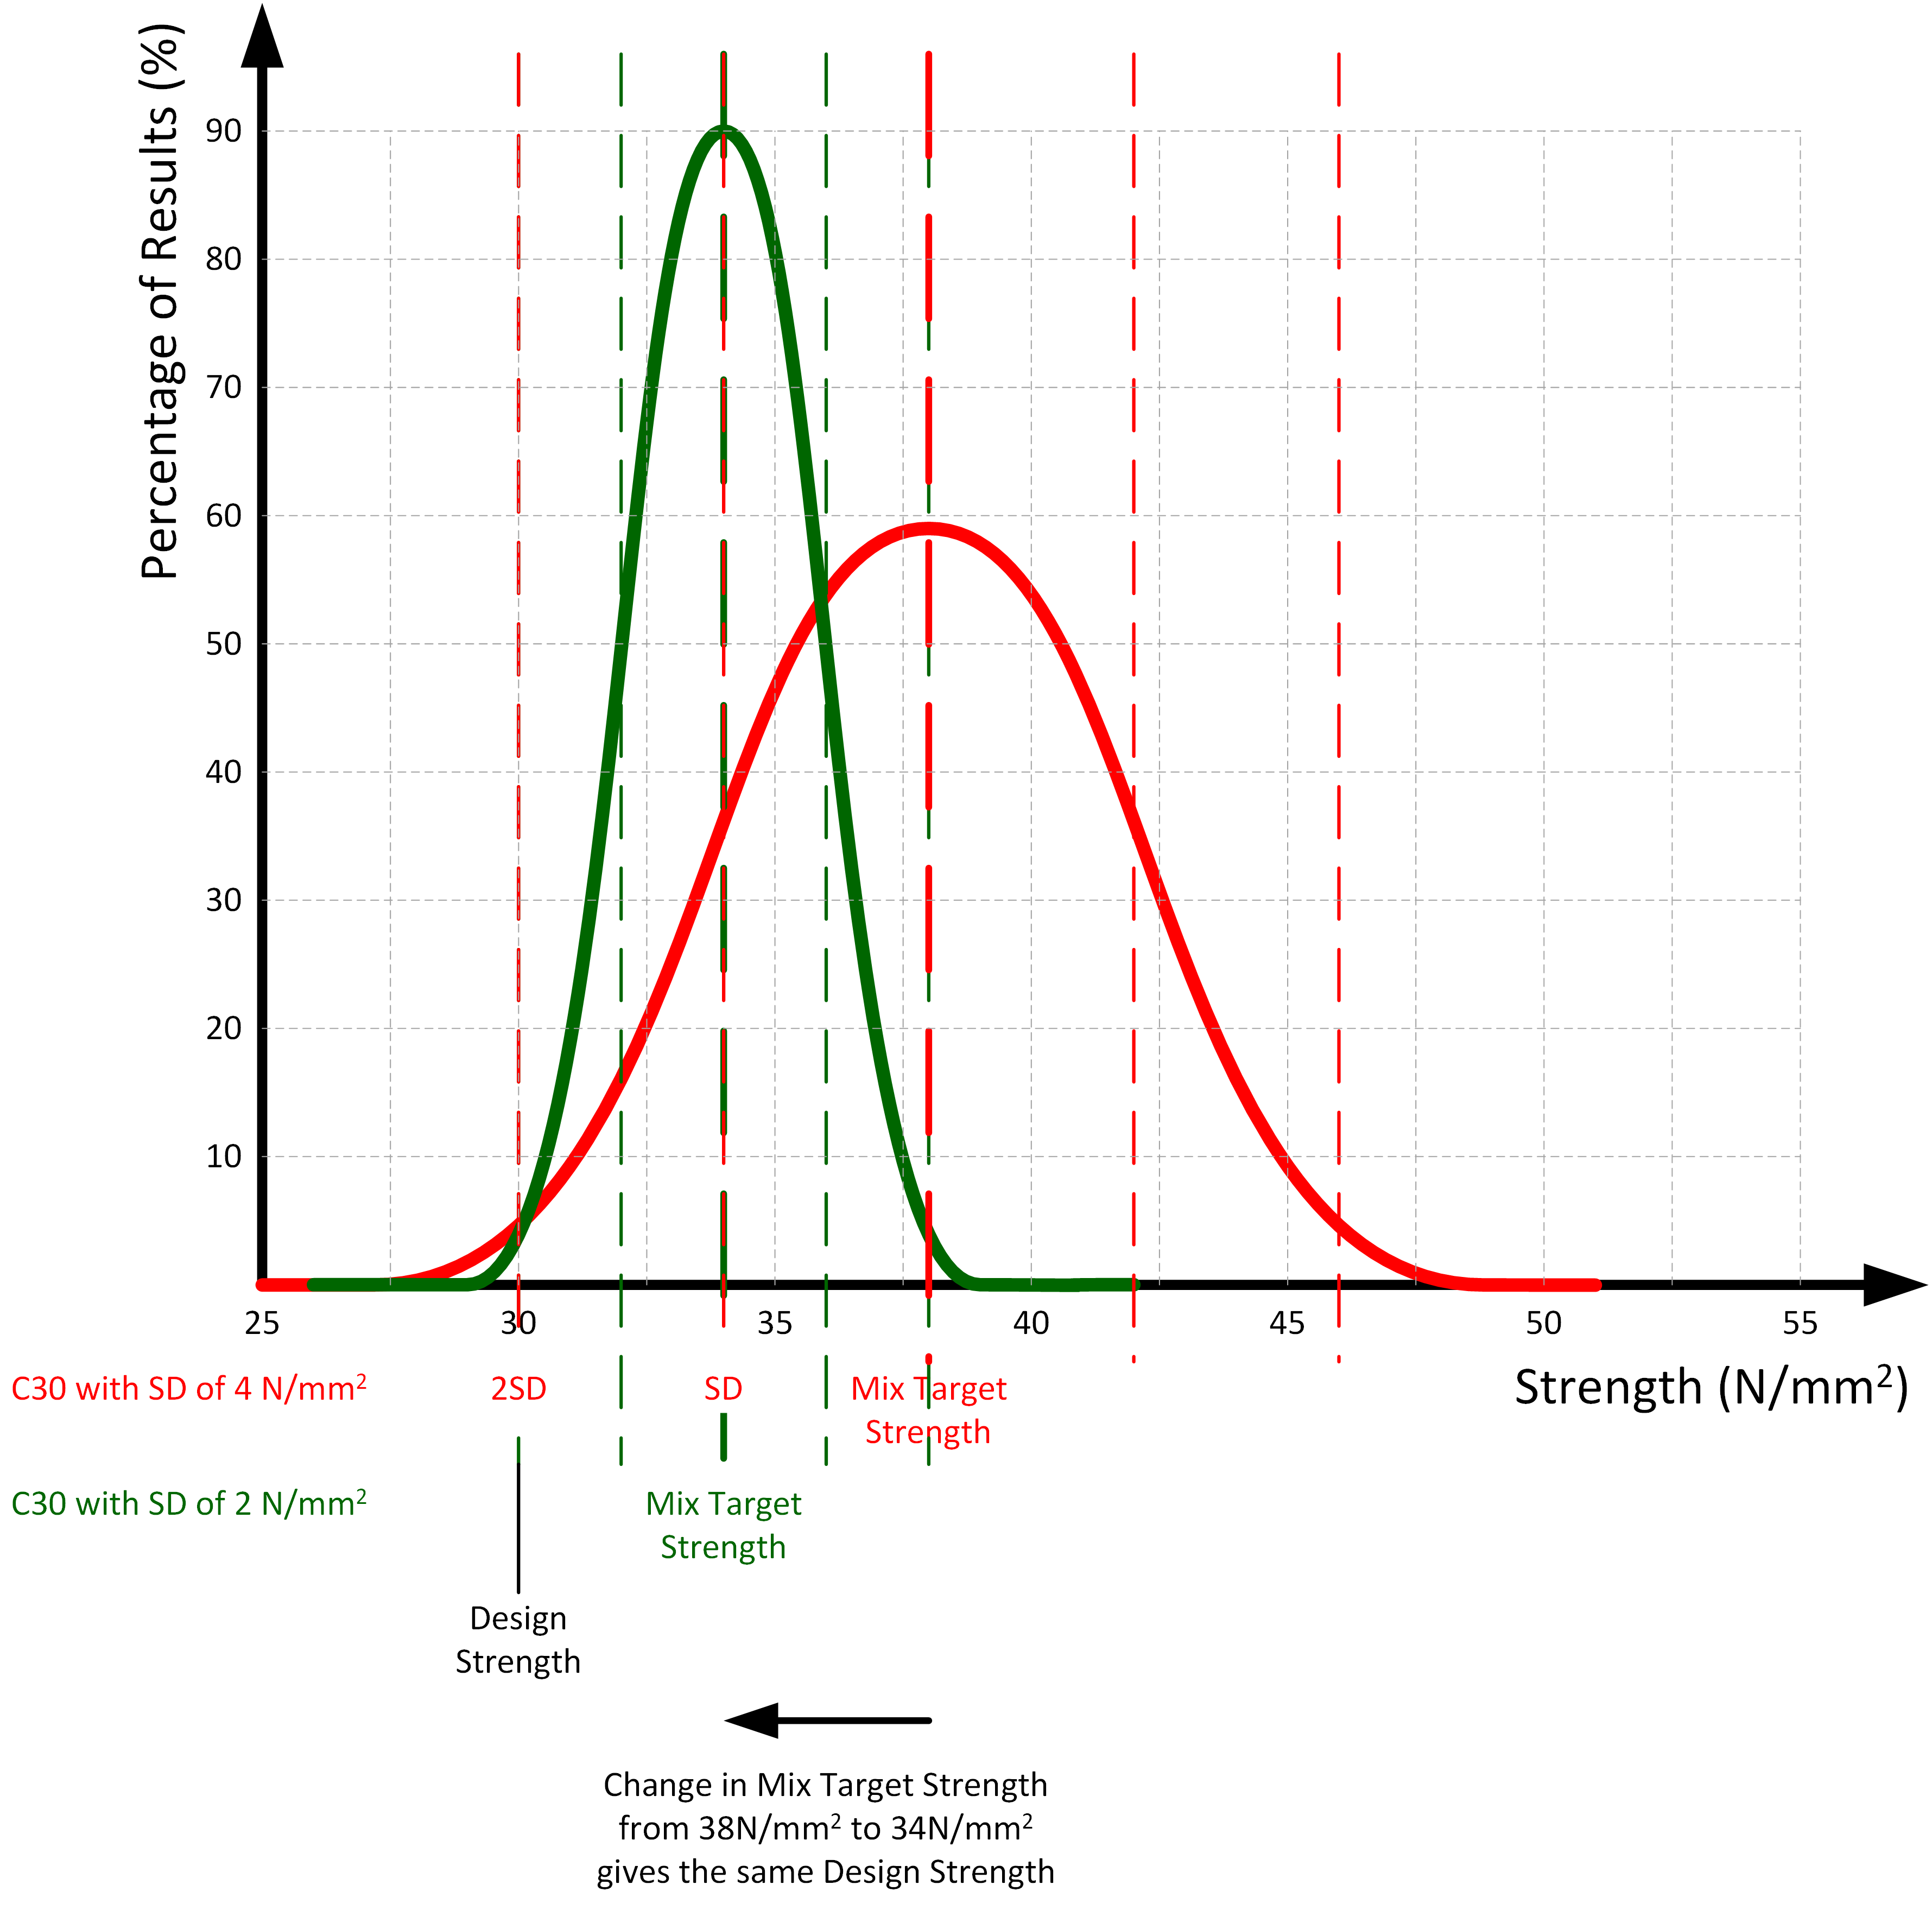
A batching plant has to design mixes based around historic results. A statistical analysis of the results can then be made and a result called the Standard Deviation (SD) gives the spread of the results around a mean value. British and EU law states that the design strength of the concrete mix must be at a point that is 2x Standard Deviations below the mean value. This means that the probability of batches will be below the design strength is only approximately 2.275%.
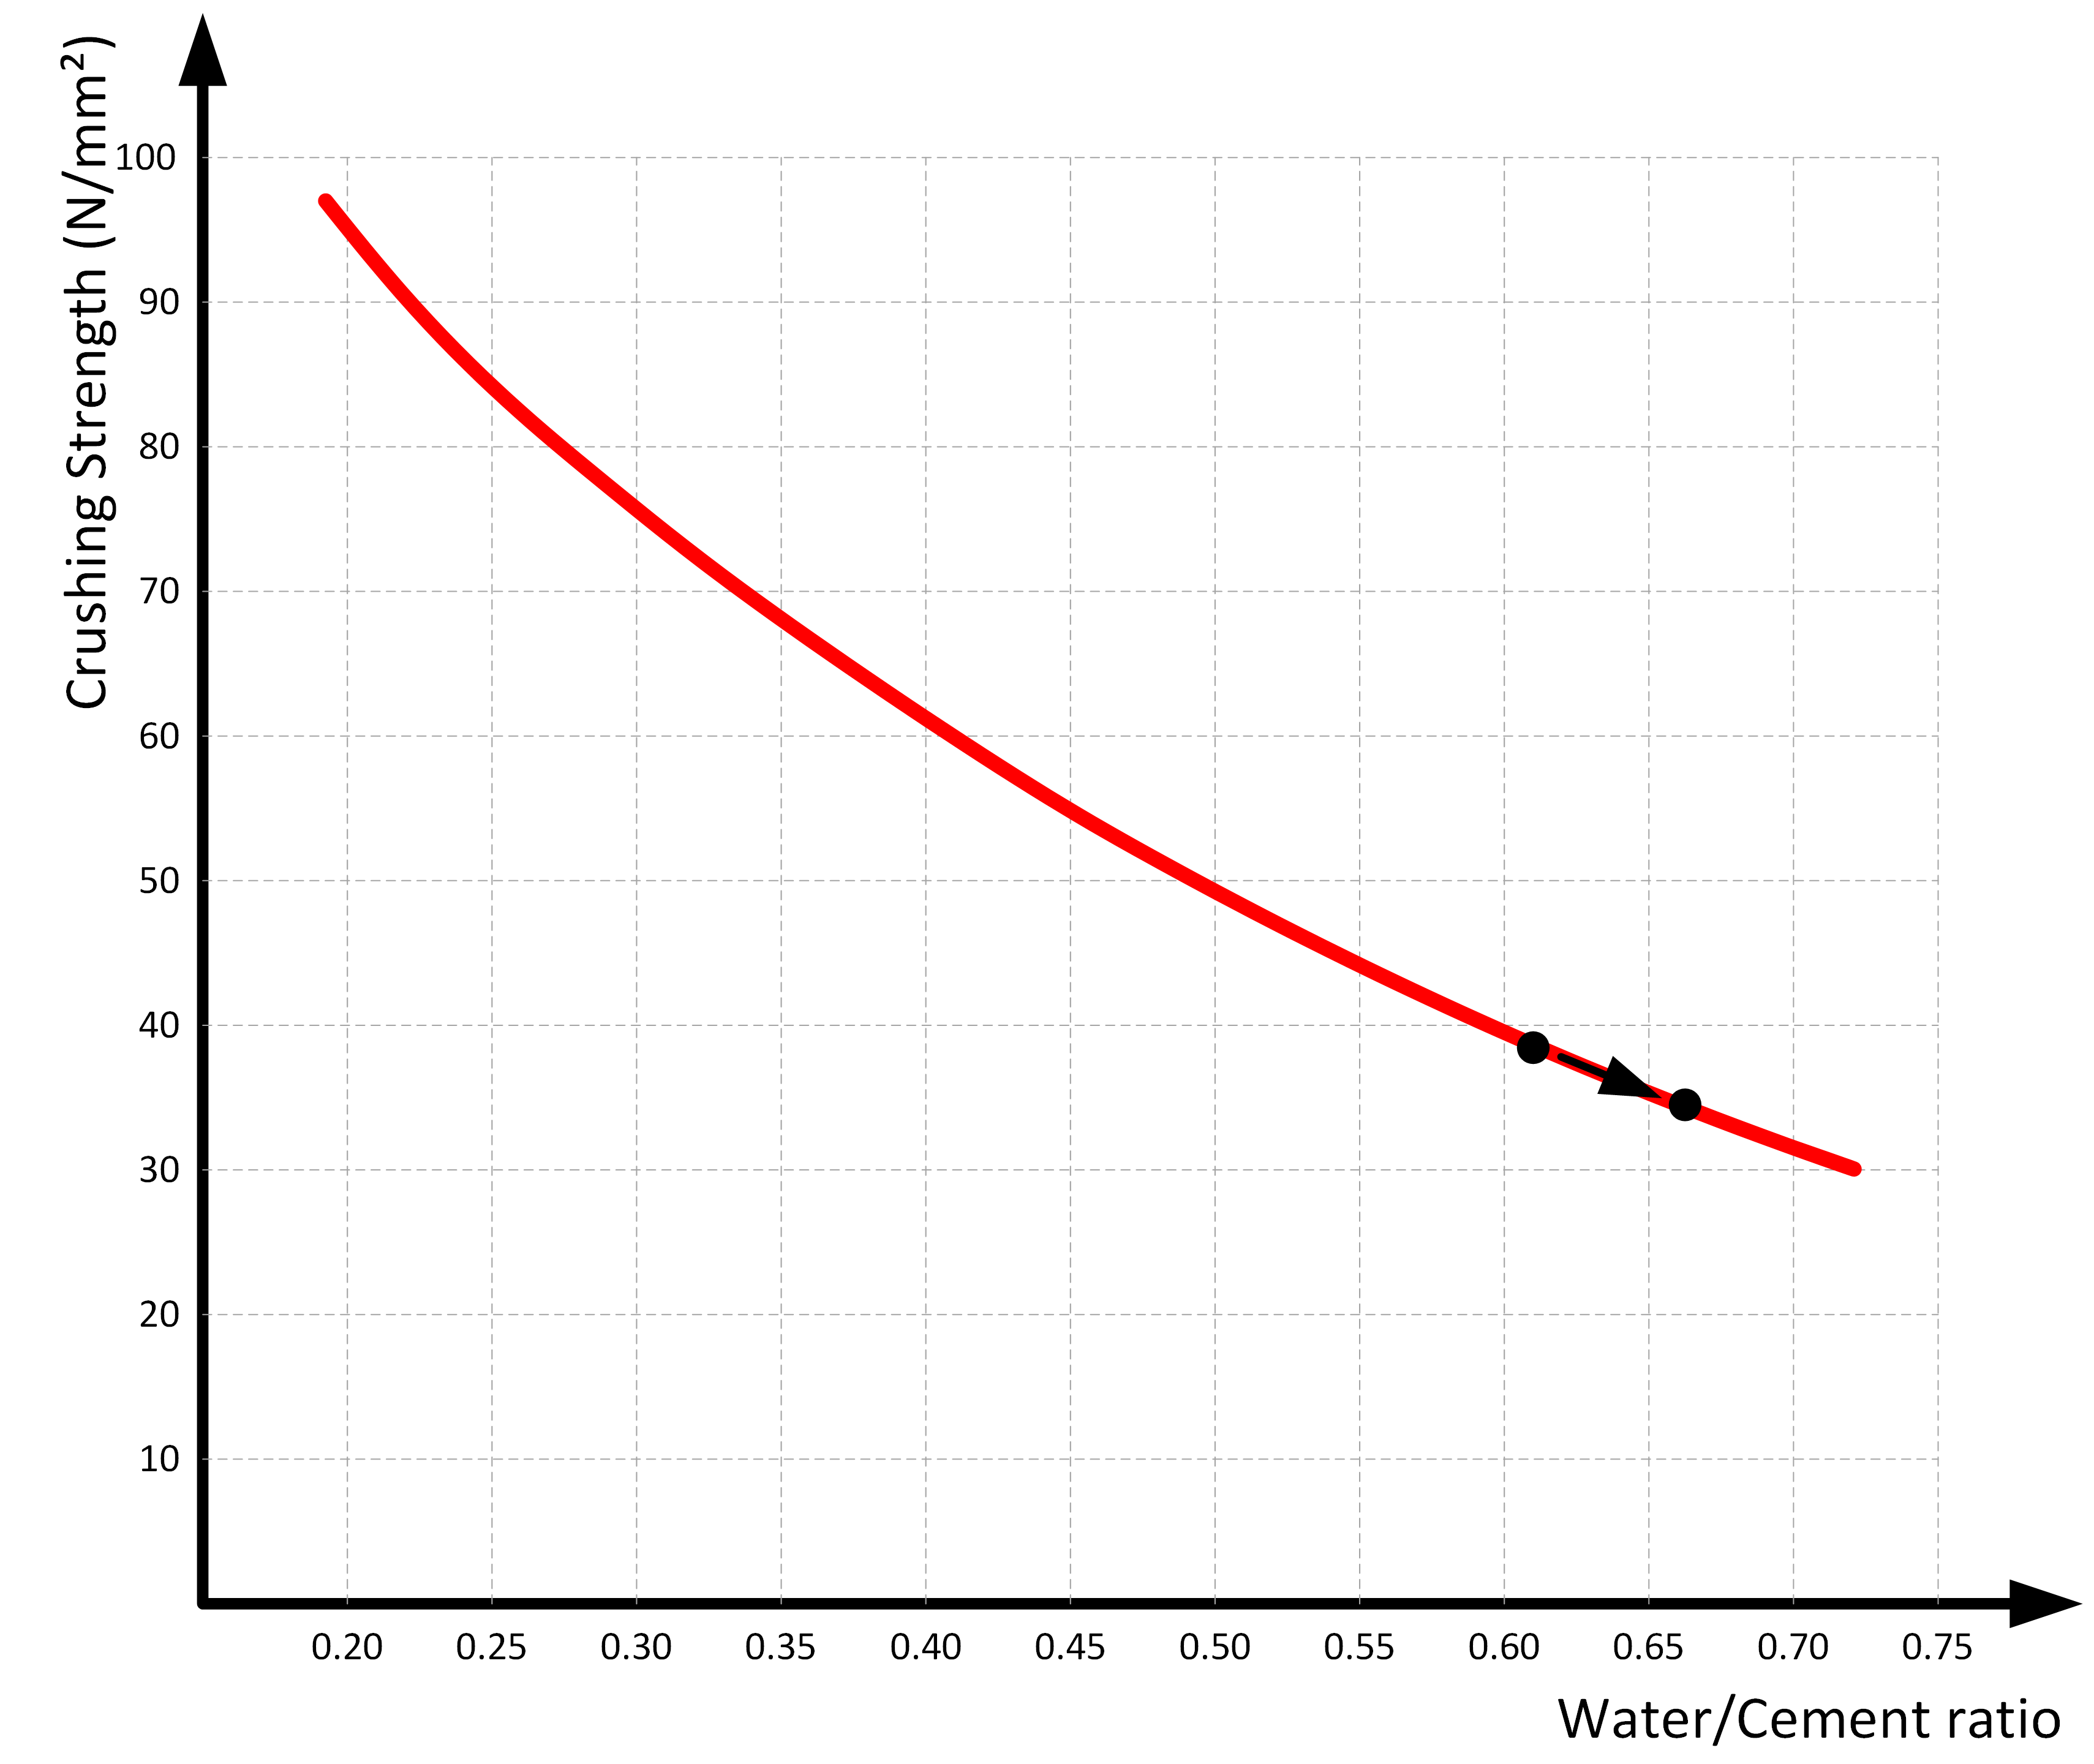
So a 38 N/mm2 with a W/C ratio of 0.605 and a water quantity of 200 l/m3 would need 331kg of cement. A 34N/mm2 mix has a W/C ratio of 0.660 and so will only need 303kg of cement presuming the water demand is constant. This still gives the same design strength of C30 but saves 28kg of cement per m3!
| Potential (worst case) uncompensated water | |||
|---|---|---|---|
| Material | Your Recipe (Dry Weights) | Using existing measurement tolerance (Automatic) | With Hydronix |
| Fine Sand 0 - 2mm | 1000 | 10.00 | 2.00 |
| Coarse Sand 0 - 4mm | 1000 | 10.00 | 2.00 |
| Gravel 8 - 16mm | 650 | 6.50 | 1.30 |
| Other Aggregates | 0 | 0.00 | 0.00 |
| Weight of uncompensated moisture | 0 | 26.50 | 5.30 |
| Total Weight | 2650 | 2677 | 2655 |
| OPC | 300 | 0.00 | 0.00 |
| PFA | 0 | 0.00 | 0.00 |
| GGBS | 50 | 0.00 | 0.00 |
| Other Cement Replacements | 0 | 0.00 | 0.00 |
| Total Cementitious Materials (Binder) | 350 | 350 | 350 |
| Mix design water (litres) | 150.00 | 150.00 | 150.00 |
| uncompensated Water in Aggregates (litres) | 0.00 | 26.50 | 5.30 |
| Total Water in mix (litres) | 150.00 | 176.50 | 155.30 |
| Designed W/C ratio | 0.43 | 0.43 | 0.43 |
| Produced W/C ratio | 0.50 | 0.44 | |
| Total Cement Needed to maintain SD target | 411.83 | 362.37 | |
| Extra cement needed to maintain SD target | 61.83 | 12.37 | |
| Potential cement cost by not using Hydronix moisture measurement | 49.47 | kg/m3 | |
| Extra Cement required to maintain w/c ratio per year | 1236.67 | Tonnes | |
| Cost of not using Hydronix per m3 | £/$/€ 3.96 | ||
| Cost of not using Hydronix per year | £/$/€ 98,933.333 | ||
| Environmental Cost of not using Hydronix per year | 1,147,626.67 kgCO2e/t | ||